May 9, 2021 University of Arizona COVID-19 Update
May 11, 2021
Image

Headlines
- For the 5th straight week we have had no employees test positive (Out of 2,884 tests administered to employees). This is a great indication of low virus activity in the Tucson community.
- Cases on campus over the past 10 days: 7 new cases out of 4,406 tests, 0.2% positivity rate.
- 11,781 students have uploaded their proof of vaccination to Campus Health. This number continues to grow daily.
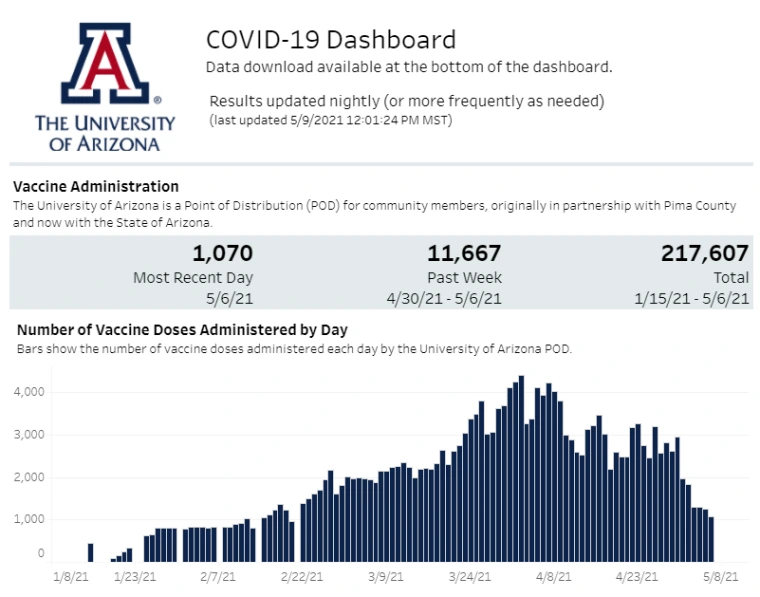
- The UA POD has administered more than 217,000 shots. By AZDHS’s estimation, 39.4% of Pima County residents and 42.2% of all Arizona residents have received at least one dose. In Pima, 87.5% of our 65+ population, and 65.9% of the 55-64 age bracket have received at least one dose. (See AZDHS’s data dashboard, Vaccine Prioritization) In Pima County 411,527 people have received at least one dose of vaccine. Over 716,779 doses have been administered in the county.
- 29.2% of the people coming to the UArizona POD have identified as Hispanic/Latinx. See more about race/ethnicity demographic data on our data dashboard.
Vaccine Administration at UA site (from UA dashboard) https://covid19.arizona.edu/dashboard
Image
Cases (from UA dashboard) https://covid19.arizona.edu/dashboard
- Over the past 10 days – only 7 new cases out of 4,406 tests, .2% positivity rate.
Image
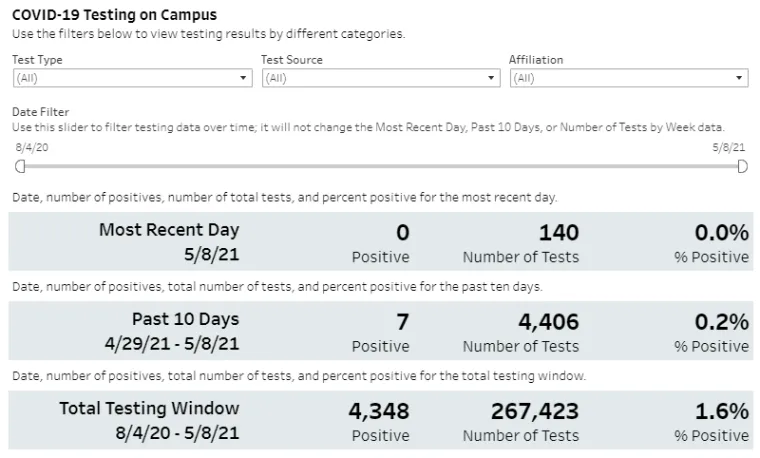
Testing (from UA dashboard) https://covid19.arizona.edu/dashboard
- Of the 4,406 tests administered in the past 10 days, 2,134 have been to off-campus students with a 0.2% positivity rate
- On-campus students have a positivity rate 0.1%
- Employees – 0 positive employees over the past 10 days, out of 669 tests.
- 267,423 tests administered total
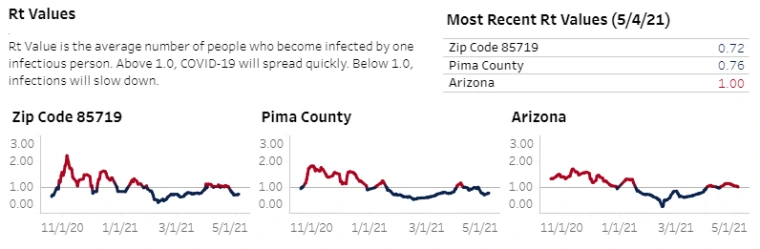
Rt Values
The Rt in the 85719 zip code is .72. Pima County’s Rt is .76, and Arizona’s is 1.00 as of 5/4.
Image